The Tools I Use to Research Dividend Stocks
What I use, how I use it, and whether it's worth your money.
I've tested dozens of investing tools over the years. Most of them are fine. A few are excellent. These are the two that survived. The platforms I actually open every week to research, score, and track the stocks in my universe.
1. Stock Simplifier Pro
What it is: A professional analysis tool that walks you through my six-step dividend framework (business, moat, management, growth, risk, valuation) and lets you score each section as you go.
Why I use it: This is my primary research tool. Every stock in the Dividend Universe has been run through Stock Simplifier. When I publish a Buy First pick or a Best Buys recommendation, the Stock Simplifier analysis is what's behind it.
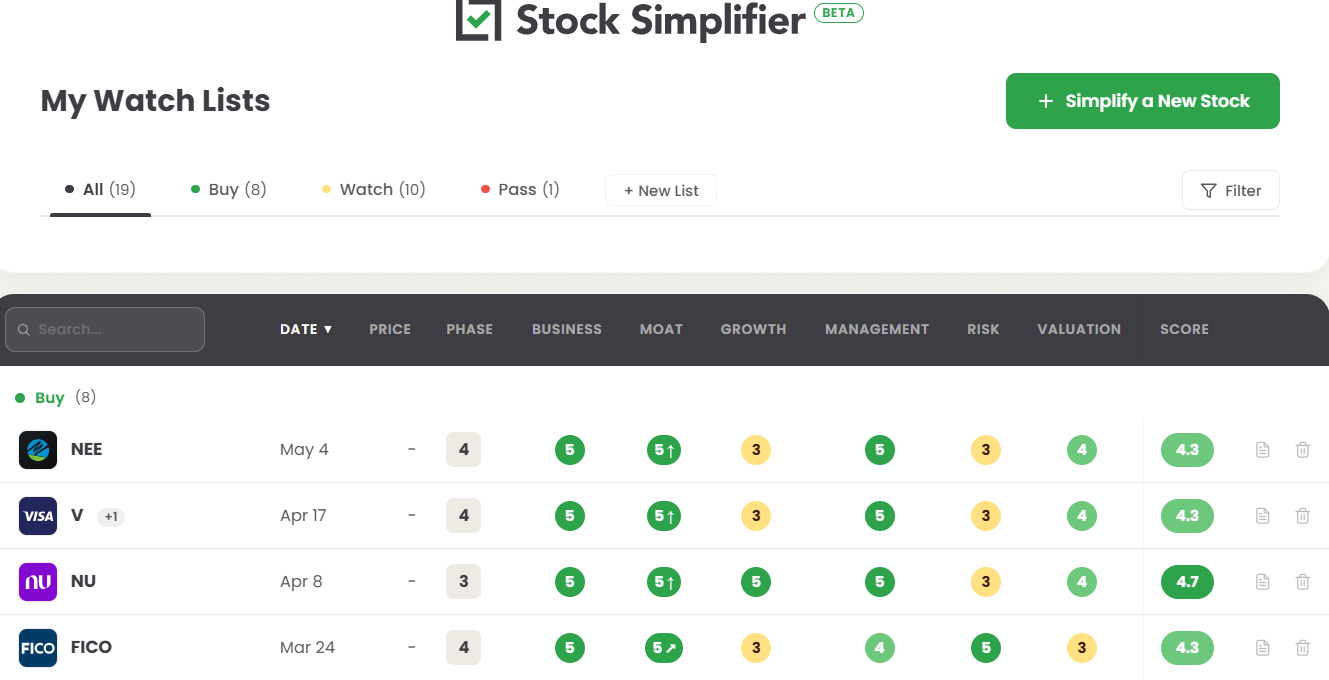
What used to take me an entire weekend now takes about 15 minutes. I open Stock Simplifier, pull up a ticker, and work through each step. By the end, I have a complete picture: is the business durable, is the dividend safe, and is the price fair?
I use it live every Thursday during the weekly webinar. If you want to see it in action before committing, that's the best way.
What I use it for:
- Running every stock through the six-step framework
- Scoring businesses on quality, moat, and safety
- Estimating fair value and setting Buy Below prices
- Tracking my watchlist and monitoring conviction changes
- Live analysis during the weekly Thursday webinar
Pricing: $399/year standalone. Included free with the Partner Plus plan ($1,299/year), which also gets you the full Dividend Universe, Buy First stocks, Best Buys, and weekly research.
2. Fiscal.ai
What it is: A financial data platform with deep historical data and clean visualizations.
Why I use it: Fiscal is where I pull all of my financial data: revenue trends, earnings history, dividend growth rates, payout ratios, balance sheet metrics. If you've seen a chart in one of my articles, it almost certainly came from Fiscal.
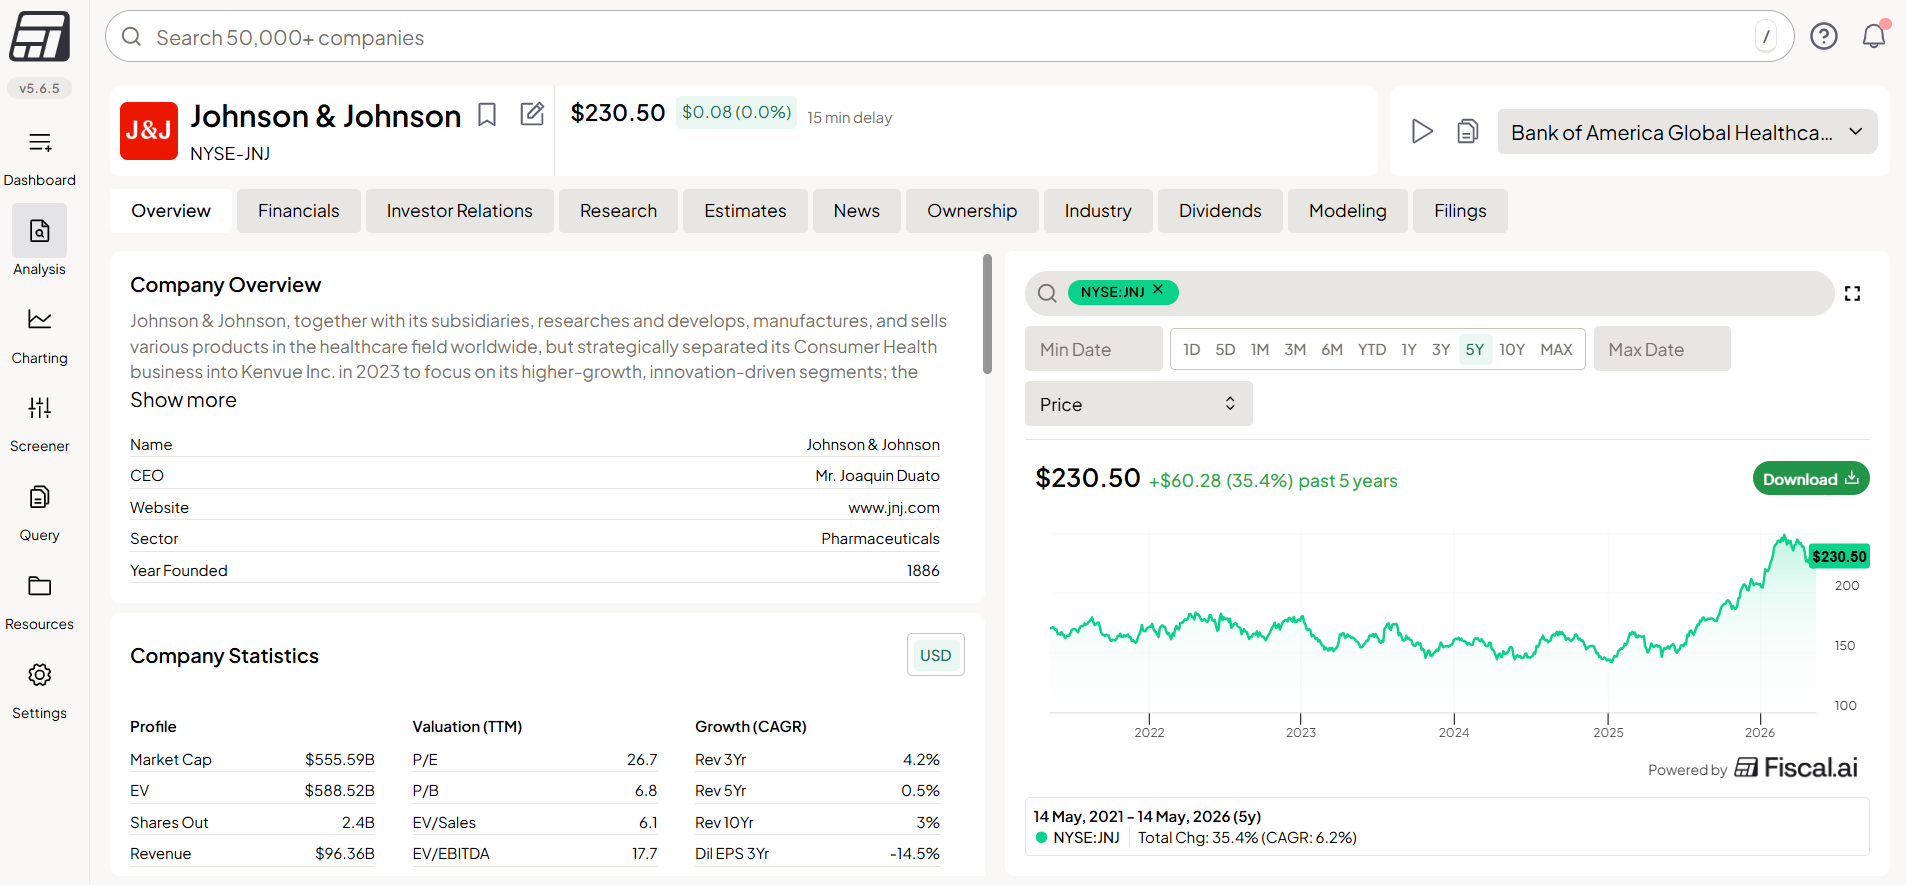
I can look at a company's 10-year dividend growth rate, overlay it against free cash flow, and see immediately whether the payout is sustainable. That's the kind of analysis that takes hours in a spreadsheet and minutes on Fiscal.
What I use it for:
- Pulling historical financial data for deep dives
- Charting dividend growth, payout ratios, and cash flow trends
- Screening for stocks that meet my quality criteria
- Building the comparison tables in my articles
Pricing: Free tier available. Paid plans from $19/month. Visit Fiscal.ai →
The bottom line
You don't need both of these tools to invest in dividend stocks. The framework is what matters. The tools just make it faster.
If I had to pick one, it would be Stock Simplifier. It's the only tool that's built specifically around the six-step framework I use for every stock in the universe. Fiscal is general purpose. Stock Simplifier is built for this.
Not sure yet? Join my free Thursday webinar. I analyze a real dividend stock live using Stock Simplifier every week. Bring your questions, watch the framework in action, and decide for yourself.
Want the full system?
Partner Plus members get Stock Simplifier Pro ($399/yr value), the full Dividend Universe, 5 Buy First stocks, 5 Best Buys every month, and weekly deep dives. All included.
Upgrade to paid$1,299/year · 30-day refund · Cancel anytime